.png?width=698&height=417&name=%E5%AE%98%E7%B6%B2logo%20(1).png)
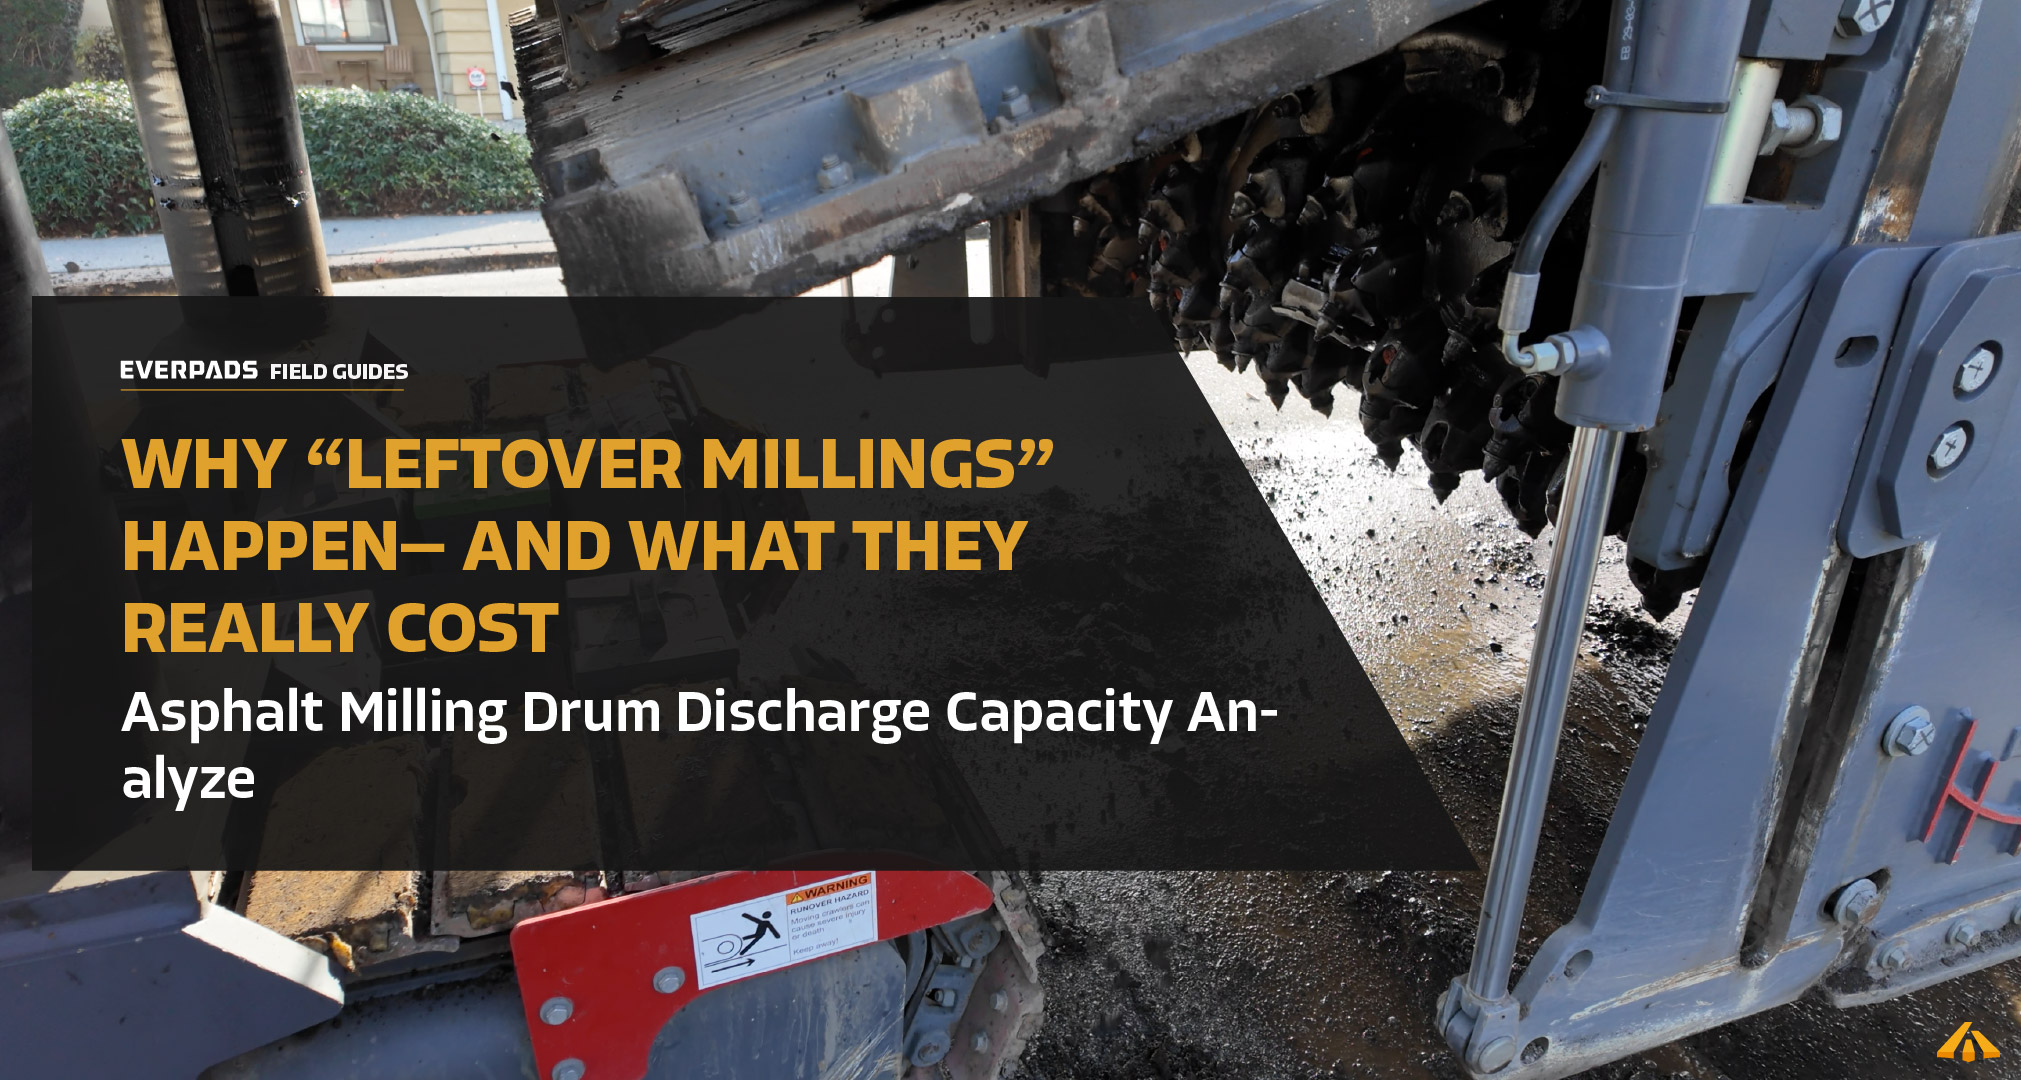
Leftover millings after milling aren’t just “messy.” They’re the early warning that your material evacuation chain is breaking—so utilization drops, truck rhythm collapses, cleanup passes multiply, and $/m² climbs. If your crew is stopping to clear plugs, slowing down for visibility, or re-sweeping before opening to traffic, you’re not losing “a few minutes.” You’re burning the lane-closure window—and your margin.
The Real Job: Meet Spec, Keep The Lane Safe, Keep The Truck Rhythm
Most agencies treat milled surfaces as traffic-facing work. That means cleanup is not cosmetic—it’s compliance and safety. (FDOT Section 327 — sweep milled area before opening to traffic)
FDOT explicitly requires sweeping milled areas before opening to traffic to remove fine material that would create dust under traffic. (ARRA CP101 — remove loose milled material prior to opening to traffic)
ARRA guidance includes cleanup language aligned with “remove dust/residue/loose milled material prior to opening to traffic.” (ARRA CP102 — micro milling cleanup prior to opening to traffic)
ARRA CP102 also states to remove dust/residue/loose milled material before opening milled surface to traffic, and it calls out cleanup methods and related QC elements. Translation for managers: discharge problems don’t just slow production—they create a spec-risk + safety-risk + public-complaint multiplier, and they often show up at the worst time (end of window)._Clean%20Result.jpg?width=2989&height=1715&name=Why%20%E2%80%9CLeftover%20Millings%E2%80%9D%20Happen%E2%80%94and%20What%20They%20Really%20Cost%20(Asphalt%20Milling%20Drum%20Discharge%20Capacity%20Analyze)_Clean%20Result.jpg)
The Engineering Reality Most Teams Miss: Your Drum Has A Discharge Capacity, Not Just A Cutting Capacity
Crews usually manage one number: “How fast can we cut?” (cutting capacity). But milling performance in the real world is governed by the weaker of two capacities:
Net output = min( Cutting Capacity , Evacuation/Discharge Capacity ) × Utilization (U)
A key point many people forget: the milling drum is not only a cutter. It also has to move material. OEM guidance describes the drum’s job as including conveying separated material to the ejector area and ejection onto the loading conveyor—not just cutting. (OEM drum guidance — the drum must cut + convey + eject)
Use this as the credibility anchor when you explain that discharge is a drum-level responsibility, not “just a conveyor problem.” What this means: you can have perfect grade control and strong horsepower, and still “produce nothing” if the drum-and-chamber system can’t evacuate material continuously.
Why Discharge Is The Hidden Production Lever (And The Fastest Way To Lose Utilization)
You can have a perfect cutting setup and still “produce nothing” if RAP cannot evacuate continuously. Net production = theoretical production × utilization (U). Discharge instability crushes U through:
- plugging stops (hard downtime)
- spillage events (slowdowns + rework positioning)
- extra cleanup passes (added cycle time)
- truck exchange delays (queue collapse)
Unit cost follows the same logic every cost engineer uses:
Unit cost ≈ hourly cost (machine rate) ÷ production rate.
(FAO — machine rate and unit-cost logic)
FAO explains machine rate (hourly cost) and shows how dividing by production rate yields unit cost. Field rule: if discharge issues steal 10–20 minutes per shift, your “production rate” didn’t drop by 10–20 minutes. It dropped by lost area, lost truck rhythm, extra cleanup, and higher $/m²._Discharging%20well.jpg?width=1280&height=772&name=Why%20%E2%80%9CLeftover%20Millings%E2%80%9D%20Happen%E2%80%94and%20What%20They%20Really%20Cost%20(Asphalt%20Milling%20Drum%20Discharge%20Capacity%20Analyze)_Discharging%20well.jpg)
The Discharge Chain: From Drum To Truck (Where It Actually Fails)
If you want to fix discharge, treat it like a chain system—not a single part. Material path (simple): Drum → Primary conveyor → Secondary conveyor → Discharge conveyor → Truck (NIOSH report — defines primary/secondary conveyors + water spray systems)
NIOSH describes the conveyor path (primary → secondary → dump truck) and notes water-spray systems used to cool cutting teeth and suppress dust. Where failure typically starts:
- Drum-in-chamber evacuation (the part most crews ignore)
- Chamber containment/sealing (buildup, leakage, poor directional flow)
- Transfer points (buildup → bridging → plugging)
- Conveyor tracking/tension (friction + heat + spillage)
- Discharge alignment/speed match (inconsistent throw into truck)
- Truck choreography (late pull-in/out, wrong position, inconsistent speed)
_Milling%20left%20materials.jpg?width=2560&height=1707&name=Why%20%E2%80%9CLeftover%20Millings%E2%80%9D%20Happen%E2%80%94and%20What%20They%20Really%20Cost%20(Asphalt%20Milling%20Drum%20Discharge%20Capacity%20Analyze)_Milling%20left%20materials.jpg)
The Missing Piece: “Drum Discharge Capacity” Inside The Milling Chamber
Most crews blame conveyors first. But many discharge failures begin upstream: the drum’s base pattern and geometry can either feed the pickup area cleanly or re-circulate material inside the housing until it turns into fines, heat, vibration, and leftover millings.
1) Base alignment coordination drives waste removal efficiency
If the spiral base pattern is not coordinated, it can hinder waste removal from the milling chamber and shorten the life of drums, holders, and teeth. Better base alignment improves waste removal efficiency, and one practical field check is whether the spiral pattern appears capable of scraping material toward the “suction/pickup” area in the chamber. (Drum assessment — base alignment coordination affects waste removal capacity)
Use this to justify why “spiral pattern coordination” is not marketing—it’s evacuation physics inside the housing. Why this matters operationally
- Mis-coordinated base alignment → poor internal conveying → more recirculation → more fines + heat → higher load + higher tooth consumption → more leftover millings and more cleanup.
2) Welding angle consistency + “wall” formation controls how much volume can be expelled
The welded angle and design of tool bases affect cutting efficiency, wear, material removal, and consistency. The same drum-assessment guidance also notes that a “higher wall” formed by base arrangement can increase the waste removal volume a drum can expel, and that precise and consistent welding improves waste removal and results. (Drum assessment — welding angle consistency + wall height relates to removal volume)
Place this link exactly where you explain why some drums “can’t clear the chamber” even when conveyors are fine. Field translation
- Inconsistent base angles → inconsistent chip trajectory → uneven feed into the evacuation path → surging discharge, spillage, and leftover millings.
3) Toolholder loosening and base wear indirectly reduce discharge capacity
Frequent tightening cycles and loosened holders can wear base holes and contact surfaces, creating variation in base height/angle and leading to uneven patterns. That uneven geometry isn’t just a “cut quality” problem—it can reduce internal conveying efficiency and increase re-circulation, which increases fines and debris behind the machine._Truck%20Received%20milling%20leftover.jpg?width=2548&height=1217&name=Why%20%E2%80%9CLeftover%20Millings%E2%80%9D%20Happen%E2%80%94and%20What%20They%20Really%20Cost%20(Asphalt%20Milling%20Drum%20Discharge%20Capacity%20Analyze)_Truck%20Received%20milling%20leftover.jpg)
Continuous Loading Is The Benchmark (Not “Occasional Stops”)
The best crews treat truck loading as a production system. When trucks flow smoothly, milling can continue non-stop. (OEM manual excerpt — continuous loading + “on-the-fly” truck changes)
An OEM manual excerpt describes front loading enabling non-stop milling through continuous loading of trucks via “on-the-fly” truck changes.
Takeaway: discharge stability is as much logistics discipline as it is machine condition. If truck rhythm collapses, discharge “problems” suddenly multiply.
The 5 Hidden Cost Buckets Of Poor Discharge (Make This A Box In The Article)
When leftover millings increase, you’re paying in five places:
- Lost utilization (U%)
Plugging + slowdowns + repositioning turns cutting time into dead time. - Truck idle + re-staging time
A broken queue is expensive: you lose loading rhythm and burn window minutes. - Extra cleanup passes
Brooms, sweepers, blowers, labor, and sometimes re-sweeps to meet opening-to-traffic expectations. - Quality + acceptability risk
Loose debris and dusty surfaces invite complaints, disputes, and “do it again” work. - Lane-closure overrun risk
The most expensive bucket: traffic control burn + downstream paving train disruption + reputational damage.
Symptom-Led Diagnostics (What To Check Before You “Push Harder”)
Treat symptoms as signals in the chain. Fixing discharge starts by identifying whether the bottleneck is inside the chamber (drum evacuation) or downstream (conveyors/trucks).
Symptom 1: Leftover millings behind the machine
What it usually means: evacuation is incomplete or inconsistent.
First checks (fast):
- Is material rolling out at the back or leaking at edges (containment/seal issue)?
- Is spillage happening at a transfer point (look for piles under handoff zones)?
- Did cleanup frequency suddenly increase vs yesterday (trend signal)?
- Drum evacuation check: does the base spiral pattern look coordinated to move material toward pickup, or does it look “random/stepped” with dead zones?
Cost risk: leftover millings = more broom time + higher open-to-traffic risk.
Symptom 2: Conveyor plugging / RAP bridging
What it usually means: buildup or material condition is overpowering evacuation.
First checks (fast):
- Is the chamber overloading (too aggressive depth/speed for evacuation capacity today)?
- Is there visible buildup at transfer points (sticky mix, moisture, contamination)?
- Is conveyor tracking/tension drifting (rubbing creates heat and drag)?
- Drum geometry trigger: if plugging rises mid-life (not just at end-of-life), check base alignment coordination and whether uneven base angles are creating surge feed into the conveyor.
Cost risk: plugging is pure utilization loss—your $/m² jumps immediately.
Symptom 3: Spillage during truck loading / inconsistent throw
What it usually means: alignment, speed matching, or truck choreography is off—or your flow is surging because upstream evacuation is unstable.
First checks (fast):
- Is the discharge conveyor aligned to the truck bed correctly and staying aligned?
- Are truck pull-in/pull-out moves smooth (no panic braking)?
- Are you forcing operators to chase the truck because the queue is unstable?
- If spillage appears as “bursts,” suspect internal evacuation surging (base/wall/angle consistency issues).
Cost risk: spillage triggers cleanup passes and slows the entire train.
Symptom 4: Dust / visibility issues force the crew to slow down
Dust control affects discharge indirectly by forcing speed reductions, increasing stops, and impairing truck positioning. (OSHA Fact Sheet 3934 — dust controls on large milling machines)
OSHA discusses water sprays (often combined with ventilation/surfactants) to control silica dust on large drivable milling machines.
First checks (fast):
- Water supply stability (pressure/volume)
- Spray coverage (blocked nozzles = localized dust + localized buildup risk)
- Maintenance rhythm (filters/nozzles/lines)
Cost risk: visibility-driven slowdowns are silent U killers—the shift looks busy, but net output drops.
Practical “Discharge Downtime” Calculator (Copy/Paste Box)
Step 1: Track lost minutes by category (per shift)
- Plugging stops: ___ minutes
- Truck exchange delays: ___ minutes
- Spillage cleanup: ___ minutes
- Extra sweeping passes: ___ minutes
Total lost time: ___ minutes
Step 2: Convert lost minutes into lost dollars per shift
Lost-time cost ($/hr) can include:
- crew idle cost + support equipment standby
- traffic control / lane-closure value burn
- lost production value (use your internal contribution margin approach)
Lost-time cost per shift = (lost minutes ÷ 60) × lost-time $/hr
Step 3: Convert to $/m²
Added discharge cost ($/m²) = (lost-time cost + added cleanup cost) ÷ net m² produced
Ready to confirm the cost of your milling leftover"?
Download the EVERPADS drum discharge efficiency calculator or Contact EVERPADS
and let our team calculate it for you directly.
| Step | Item | Formula / Input | Notes |
|---|---|---|---|
| Step 1 | Plugging stops | ___ minutes | Track lost minutes per shift |
| Truck exchange delays | ___ minutes | Track lost minutes per shift | |
| Spillage cleanup | ___ minutes | Track lost minutes per shift | |
| Extra sweeping passes | ___ minutes | Track lost minutes per shift | |
| Total lost time | ___ minutes | Sum of all discharge-related lost minutes | |
| Step 2 | Lost-time cost rate | $___ / hr | Can include crew idle cost, support equipment standby, traffic control / lane-closure value burn, and lost production value |
| Lost-time cost per shift | (lost minutes ÷ 60) × lost-time $/hr | Converts time loss into dollar loss | |
| Step 3 | Added cleanup cost | $___ | Include extra sweeping, broom, labor, or related cleanup cost |
| Net m² produced | ___ m² | Use actual net output for the shift | |
| Added discharge cost ($/m²) | (lost-time cost + added cleanup cost) ÷ net m² produced | Final unit-cost impact from discharge downtime |
Worked Example (Placeholder Structure — Replace With Your Site Numbers)
Example inputs (illustrative):
- Net production: 1,200 m²/hr
- Discharge-related lost time: 30 min per shift
- Lost-time value: $900/hr
- Added cleanup: $250 per shift
- Net output per shift: 6,000 m²
Math:
- Lost-time cost = (30/60) × 900 = $450
- Total added cost = 450 + 250 = $700
- Added cost per m² = 700 ÷ 6,000 = $0.12/m²
Manager translation: $0.12/m² looks small until you multiply by nightly quantity—and then add overrun risk (the real killer).
| Category | Input / Formula | Why it matters |
|---|---|---|
| Net production | 1,200 m²/hr | Baseline production rate |
| Discharge-related lost time | 30 min per shift | Time lost to plugging, delays, and cleanup |
| Lost-time value | $900/hr | Converts downtime into dollar impact |
| Added cleanup | $250 per shift | Extra sweeping, labor, or cleanup burden |
| Net output per shift | 6,000 m² | Total area used for unit-cost calculation |
| Lost-time cost | (30 ÷ 60) × 900 = $450 | Shift-level downtime cost |
| Total added cost | 450 + 250 = $700 | Combined downtime and cleanup cost |
| Added cost per m² | 700 ÷ 6,000 = $0.12/m² | Practical unit-cost increase |
| Manager takeaway | $0.12/m² looks small until multiplied across nightly production and overrun risk | Best line for internal justification |
Execution Plan: Inspection Rhythm + Truck Choreography (Stops The Cycle)
Daily (pre-shift + after first pass)
- Transfer point buildup check (look under the handoff zones)
- Conveyor tracking quick check (early mis-tracking becomes late plugging)
- Discharge alignment check (make spillage unacceptable early)
- Water/dust basics check (visibility is production)
- Drum evacuation check (new): look for coordinated spiral alignment behavior and any “dead-zone” accumulation inside the housing after the first pass.
Mid-shift triggers (stop/adjust before collapse)
Stop and adjust when you see:
- plugging frequency increasing
- spillage trend increasing
- truck rhythm breaking (idle trucks, rushed maneuvers)
- leftover millings increasing after pass #1
- discharge surging (bursts) instead of steady flow
Weekly
- Trend log: plugging stops/week, cleanup passes/week, truck idle events/week
- Fix root causes, not symptoms: transfer points, seals/scrapers, conveyor alignment, and drum base alignment/weld consistency if evacuation is unstable mid-life
Procurement / Internal Justification Script (30 Seconds)
“We’re not paying for ‘cleanup.’ We’re paying for net production and safe opening to traffic. If discharge instability causes extra stops, truck idle time, and extra sweeping, our $/m² rises and our lane-closure overrun risk spikes. Let’s track lost minutes and convert it to $/m²—then fund the fixes that protect utilization.”
Key Takeaway
A milling machine only “produces” when material evacuates continuously. Discharge stability is production—and it’s one of the fastest levers to protect utilization, unit cost, and lane-closure reliability.
Ready to confirm the cost of your milling leftover"?
Download the EVERPADS drum discharge efficiency calculator
or Contact EVERPADS
and let them calculate it for you directly.
FAQ
What causes leftover millings during cold milling?
Leftover millings usually appear when the material evacuation chain becomes unstable. The problem may start inside the milling chamber, where the drum fails to move material cleanly toward the pickup area, or downstream at transfer points, conveyors, and truck loading. When discharge becomes inconsistent, loose material remains behind the machine, cleanup time increases, and production efficiency drops.
Are leftover millings always caused by a conveyor problem?
No. Many crews blame the conveyor first, but discharge problems often begin upstream inside the milling chamber. If the drum’s base pattern, holder condition, or internal material flow is inconsistent, material can recirculate in the housing before it ever reaches the conveyor smoothly. That creates fines, heat, surging flow, plugging, and leftover millings behind the machine.
How does poor milling drum discharge capacity increase cost per square meter?
Poor discharge capacity reduces utilization by creating plugging stops, spillage events, truck exchange delays, and extra cleanup passes. Because unit cost is tied to hourly cost divided by production rate, even small discharge interruptions can raise cost per square meter. The real impact is not only downtime, but also lost net output, disrupted truck rhythm, and higher lane-closure overrun risk.
What is the difference between cutting capacity and discharge capacity on a road milling machine?
Cutting capacity is how fast the machine can break and remove material in theory. Discharge capacity is how effectively the machine can evacuate that material through the chamber and conveyors to the truck. In practice, net output is limited by the weaker of the two. A machine may cut aggressively, but if it cannot evacuate material continuously, actual production still falls.
How can crews tell whether the discharge bottleneck starts in the drum chamber or downstream?
A fast field check is to watch where the symptom first appears. If material is leaking, recirculating, or accumulating inside the chamber and leftover millings increase immediately behind the machine, the problem may begin with drum evacuation. If material is reaching the handoff zones but buildup, plugging, or spillage appears at transfer points or during truck loading, the bottleneck is more likely downstream.
Can truck exchange problems create discharge issues even when the machine is in good condition?
Yes. Discharge stability depends on truck rhythm as much as machine condition. If truck pull-in and pull-out timing is inconsistent, operators must slow down, adjust conveyor alignment, or interrupt loading. That breaks continuous flow and makes discharge problems appear worse. Smooth on-the-fly truck changes help maintain steady evacuation, reduce spillage, and protect utilization across the shift.
Does dust control affect milling discharge performance?
Yes. Dust control affects discharge indirectly but significantly. If water supply is unstable or spray coverage is poor, visibility drops and operators are forced to reduce speed or stop more often. Poor spray performance can also contribute to localized buildup and unstable material flow. In the field, dust-related slowdowns quietly reduce utilization even when the crew appears busy.
What should crews inspect daily to reduce leftover millings and discharge downtime?
Crews should inspect transfer point buildup, conveyor tracking, discharge alignment, water spray condition, and truck loading rhythm every shift. They should also check whether the drum and chamber are evacuating material smoothly after the first pass. Rising plugging frequency, increasing spillage, or more leftover millings are early warnings that discharge capacity is falling and should be corrected before production collapses.
How do you calculate the cost of discharge-related downtime in asphalt milling?
Start by tracking lost minutes per shift from plugging stops, truck exchange delays, spillage cleanup, and extra sweeping. Convert those minutes into dollars using your lost-time hourly value, then add cleanup cost. Finally, divide total added cost by net square meters produced. This gives a practical discharge-related added cost per square meter that managers can use for field decisions.